(This is the third in a multi-part series comparing each FBS team’s recruiting prowess with actual on-field success. See Part 1 here & Part 2 here)
by Jeff Fuller (@jjfuller72)
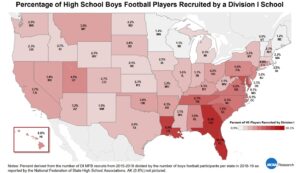
Florida is often lauded by recruiters as a “gold mine” for finding top level FBS and future NFL-caliber high school recruits. In fact, a 2020 NCAA analysis showed that over 10% of all Florida High School football players were recruited by a D1 school, the highest of any state.
Florida high schools cumulatively had more players on NFL rosters (176) last season than any state but Texas (190.) The same source showed that Florida was also the 5th highest state in per-capita in NFL roster representation & that IMG Academy, in Bradenton, Florida, was the high school with the most active NFL players at 14.
Given the quantity and quality of talent in a state that is also 7th nationally in population density (highest outside the Northeastern-Atlantic region, and nearly twice as population-dense as any other southern state) it makes sense that college coaching staffs focus their resources to “recruit Florida.”
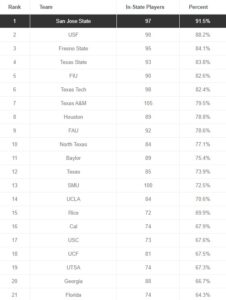
Nearly all FBS schools have rosters full of “home-grown” kids, with the 3 most populous states leading this trend. In fact, according to a 2019 roster analysis 19 of the 20 teams reporting more than two-thirds of their rosters being “in-state” players were California-, Florida- and Texas-based programs.
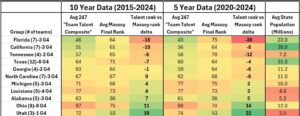
As discussed in Part 1 it is a bit head-scratching that the 7 Florida-based FBS schools, on average, “underperformed” (per 10 year MCR-Massey Composite Ranking) their talent level (per 10 year TTR-Team Talent Ranking per 247) more than any other state by a wide margin despite the clear quantity and quality of talent as mentioned above. (the details of the methodology are discussed in Part 1)
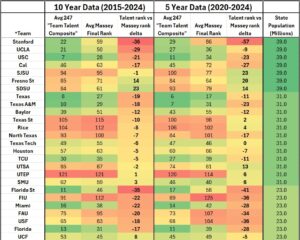
Those seven schools had an average TTR of 46th compared to a MCR of 64th over 10 years for a -18 underperformance, which expanded to a massive -30 average underperformance over the last 5 seasons. This underperformance transceded other broad trends of P4 vs G6 net average spread of +21 performance between those two broad groups. In fact, FIU, FAU, & USF stood out as the three worst “underperforming” schools among all G6 conferences at both the 10 and 5 year data sets. Only UCF bucked the “Florida underperformance” trend, and not by a wide margin.
The seven California-based schools had an average TTR of 51st, similar to Florida school’s 46th, but did relatively better at -10 & -8 underperformance rates at 10 & 5 years respectively. Texas was the least underperforming of the 3 largest states at -7 and -4 respectively. The two tables below include: 1) the state averages of some of the largest and/or most interesting states and 2) the individual schools in the three largest states.
Geographic and Demographic analysis (regardless of conference or “P4” status) shows a small trend towards underperformance of -3 among the 78 schools from states with a population of 7 million or more and an overperformance of +4 among all 52 schools from states below that threshold. More detailed population stratification revealed a strong trend towards underperformance of -11 among all 26 schools in the largest three states of California, Texas, and Florida and a slight overperformance of +2 to +4 in groups of middle and smaller states respectively. When isolating just the 5 schools from states with a population of 2 million or less, a massive overperformance of +19 was revealed. All of these trends were even more pronounced over the last 5 year time period than over the entire 10 years analyzed.
While the MCR was tightly grouped and consistent in the 65-68 range in all of these different population-based groupings, the TTR was strongly slanted toward larger-state programs having more talented rosters than medium states, who, in turn, had more talented rosters than the less-populated states. However, the improved talent level didn’t translate into better results when all FBS schools were included. It is most likely that highly talented players from lower population-density states are overlooked and don’t get rated as high as they would have if they played in larger markets.
When analyzing individual states with 3 or more FBS schools, while Florida’s underperformance was discussed above, Utah stood out as the most overperforming state at +22 over the last 5 years and +19 over the entire 10 year analysis (scroll down to the end of this article to see Utah and many other state’s individual programs broken down.) Some overperforming states, like Ohio, Alabama, Louisiana, and Michigan may seem to buck some of the other expected population &/or conference trends, but make more sense when accounting for the fact that all of those states have more G6 than P4 schools. For example, while LSU shows an underperformance of -9 (slightly better than the average SEC school) it is overwhelmed statistically by the +8 average overperformance of the 4 other G6 Louisiana-based schools.
Three states (Arizona, Iowa, & Kansas) have identical profiles of two P4 and no G6 programs, yet the results are quite disparate. Both Iowa and Iowa St are among the most overperforming programs and both Arizona an Arizona St are among the most underperforming. Kansas and Kansas St are nearly identical in their low TTR (68-70), but divergent in their MCR by 61 spots with the Jayhawks being the 12th most underperforming FBS team at -27 while the Wildcats are the most overperforming of all P4 teams at +32. However, when looking at just the last five years, Kansas’ underperformance nearly disappears at -5 and Kansas St improves up to +40 (2nd only to BYU’s +47 among all P4 schools).
Utah and Mississippi have similar profiles of two P4 and one G6 programs and state populations of 3.5M & 2.9M respectively. While the combined avg TTR was 72 for UT and 46 for MS, the MCR was flipped with UT having a better average at 53 compared to 58. This translated into an average overperformance of +19 in UT and underperformance of -12 in MS.
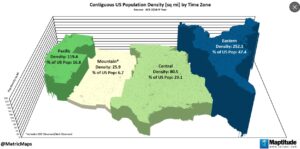
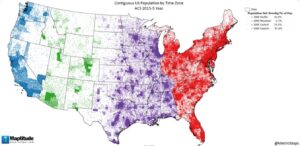
When looking at other regional groupings, while there was a slight difference between southern and non-southern schools, at -3 vs +3 respectively, the only notable standouts were an underperformance of -5 in the Pacific and a +9 overperformance in the Mountain Time Zone. No “east coast bias,” an oft cited fan complaint of AP voters, was detectable in this broad analysis. The population-dense ETZ might be expected to have higher recruiting ratings/lower-performing programs until we remember that high school and college football are relatively far less popular in the northeast than most other regions, especially the south and mid-west.
The MTZ represents only 6.7% of the total US population and has a population density 10, 5, and 3 times smaller than the Eastern, Pacific, and Central Time Zones respectively. Given the previously identified population-density trends, the “overperformance” of the Mountain time zone is likely due to the relative difficulty of identifying and properly rating high-level talent in “off the radar” locations where recruiting services and coaches are unwilling to commit significant time and money. They often may feel constrained to make “a business decision” to focus their limited time and resources in population-dense areas that should provide a better “return on investment.”
A few more individual states listed below without commentary:
Georgia:
North Carolina:
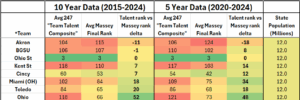
Ohio:
Michigan:
Tennessee:
Alabama:
Louisiana:


